Rest Day Gaps Reshaping Player Prop Markets in Mid-Season League Schedules
Written by Sam Perry · Jun 4, 2026
Rest Day Gaps Reshaping Player Prop Markets in Mid-Season League Schedules
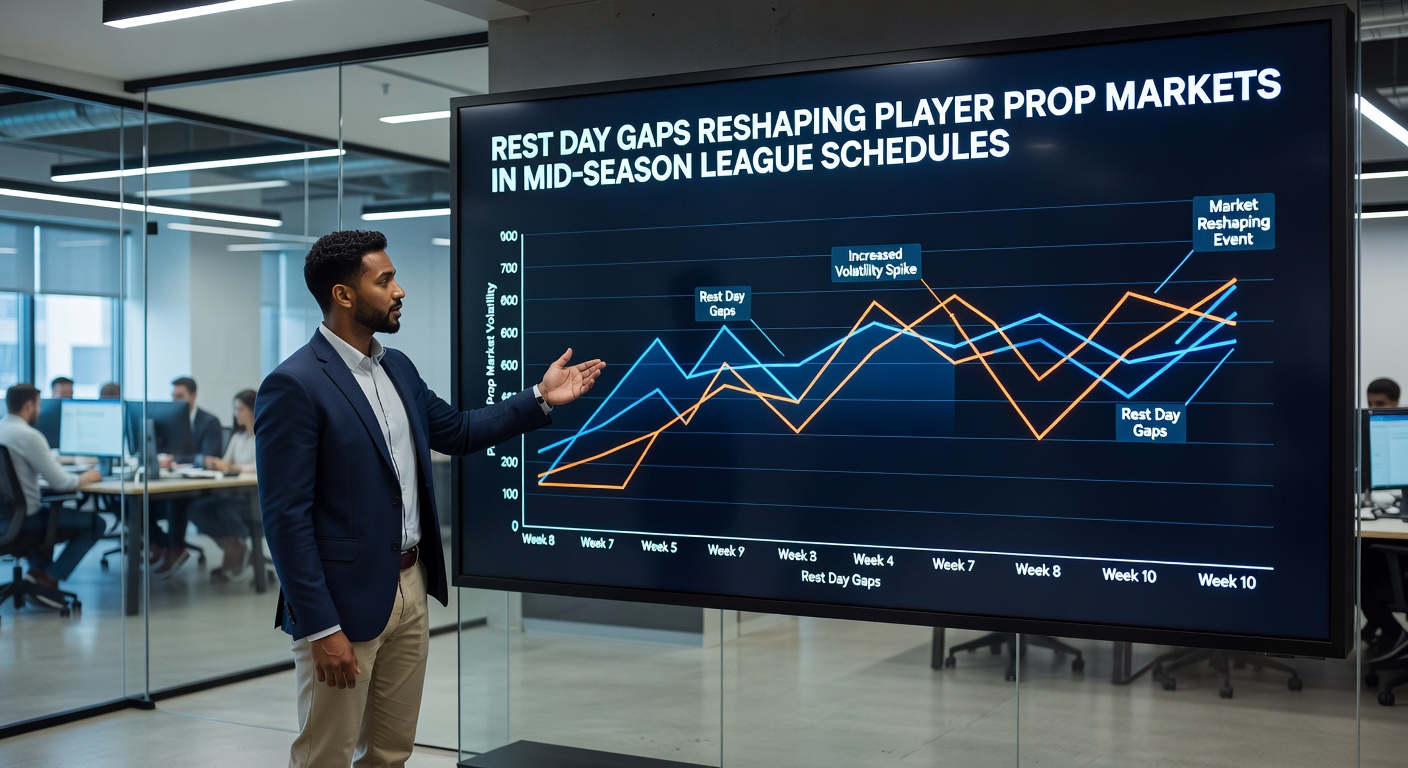
League schedules create uneven rest intervals between games and these gaps directly influence player prop markets across basketball, hockey and baseball circuits, where betting lines adjust based on recovery data collected from multiple seasons. Teams in the middle of packed calendars often see starters with three or more days off produce elevated scoring or assist totals compared to those playing on short rest, and oddsmakers track these patterns closely to set accurate thresholds.
Schedule Construction and Recovery Patterns
Front offices build calendars that bunch games together for television windows while leaving other squads with extended breaks, and this uneven distribution shows up in box scores when analysts compare per-minute production after one day versus four days of rest. Data from recent campaigns indicates players logging heavy minutes on back-to-back nights post fewer efficient shots, whereas those returning after longer intervals post improved field-goal percentages and rebound rates. Leagues release these schedules months in advance yet mid-season adjustments for weather or venue conflicts can widen or shrink the gaps, forcing bettors to monitor updated travel and practice reports.
Prop Market Adjustments in Basketball and Hockey
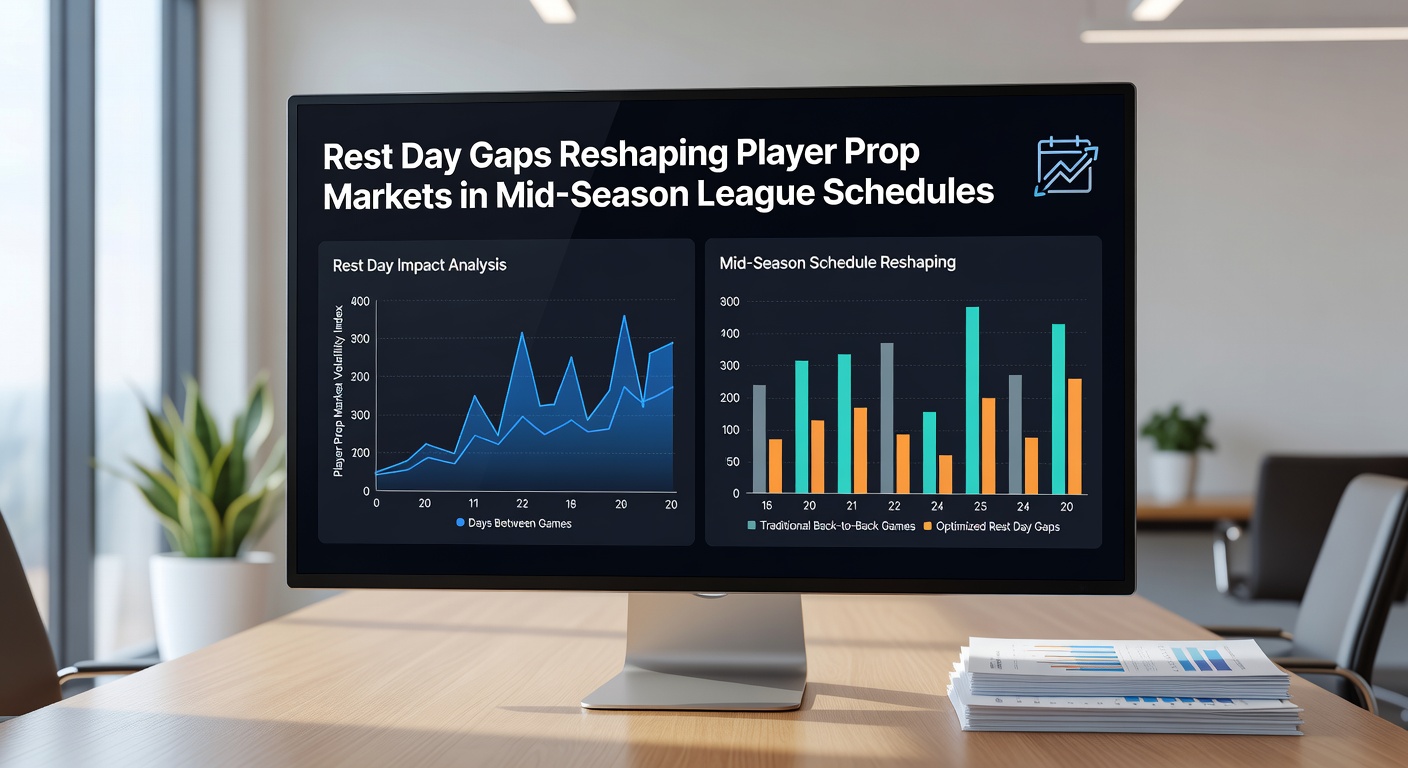
Player prop markets for points, rebounds and assists move when rest differentials appear on the schedule, and sharp money often targets performers coming off extended downtime because historical splits reveal consistent upticks in usage. In June 2026 several conferences will still be navigating compressed playoff pushes while regular-season holdovers carry varying rest profiles, giving markets time to incorporate fresh recovery metrics before lines lock. Observers note that goalie props in hockey respond similarly, with netminders on longer rest posting lower save percentages in some datasets yet higher win probabilities overall because offensive support increases.
Tracking Usage and Efficiency Splits
Researchers compile minute-by-minute logs to isolate how rest affects shot selection and defensive assignments, then feed those numbers into models that project prop ceilings. One study released by the Australian Institute of Sport examined workload across multiple winter leagues and found athletes with at least three rest days increased high-intensity efforts by measurable margins compared with consecutive-game participants. Those figures appear in pre-game notes that sportsbooks reference when shading totals for individual categories like three-pointers made or blocked shots.
Baseball and the Impact of Off Days on Pitcher Props
Starting pitchers see their strikeout and earned-run props swing with extra rest because bullpen usage and pitch-count management shift accordingly, and teams with four-day gaps between starts often deploy deeper arsenals. Mid-season series that follow cross-country travel compress recovery windows for some clubs while granting others an extra day, and those distinctions surface in daily fantasy and prop pricing. Analysts cross-reference pitch-tracking data with rest logs to identify when velocity readings or spin rates deviate from seasonal averages.
League-Wide Data Sources and Market Response
Betting platforms integrate public schedule information with proprietary tracking feeds, allowing lines to reflect rest differentials before tip-off or first pitch, and sharp bettors scan for discrepancies between projected usage and posted numbers. The Canadian Centre for Ethics in Sport has published workload guidelines that teams reference when planning practice intensity around rest windows, supplying additional context that filters into advanced analytics. Those guidelines help explain why certain role players post career-high prop outputs after extended breaks while others maintain steady volume regardless of schedule spacing.
Travel and Fixture Overlap Effects
Consecutive home stands create longer rest pockets for some squads while road trips compress recovery for others, and these patterns compound when leagues schedule matinee games after late-evening contests. Mid-season tournaments add another layer because participating teams receive mandated rest afterward, shifting prop expectations for the immediate follow-up slate. Data sets that segment performance by rest category help markets price individual matchups more precisely, reducing the frequency of large line moves after opening numbers post.
Conclusion
Rest day gaps continue to influence how player prop markets price individual outputs throughout mid-season schedules because historical splits and real-time tracking data provide measurable edges when recovery windows differ. Leagues maintain dense calendars that guarantee these variations, and participants across betting and analytics communities monitor the resulting patterns to align projections with actual line movement. As schedules evolve through 2026, the same rest-based adjustments will remain central to accurate market construction in multiple sports.