Mapping Distance-Based Fatigue Factors That Adjust Basketball Total Lines in Back-to-Back Road Games
Written by Erik Otto · Jul 2, 2026
Mapping Distance-Based Fatigue Factors That Adjust Basketball Total Lines in Back-to-Back Road Games
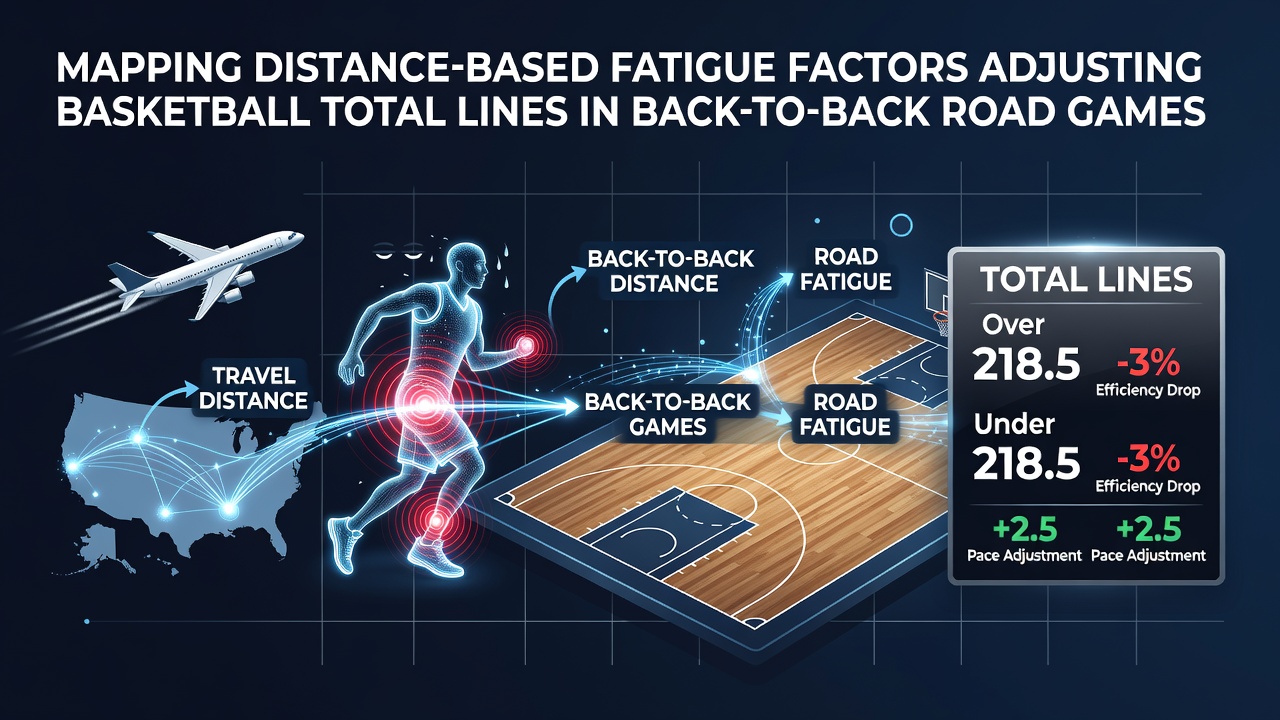
Analysts track distance-based fatigue through detailed travel logs and performance metrics in professional basketball, where back-to-back road games create measurable drops in player output that influence total scoring lines. Teams covering hundreds of miles between contests often see reduced shooting accuracy and slower transition play, prompting adjustments in projected point totals. Data compiled through league schedules shows these patterns hold across multiple seasons, with longer hauls correlating to tighter game scripts and fewer possessions overall.
Travel Metrics and Their Role in Fatigue Calculation
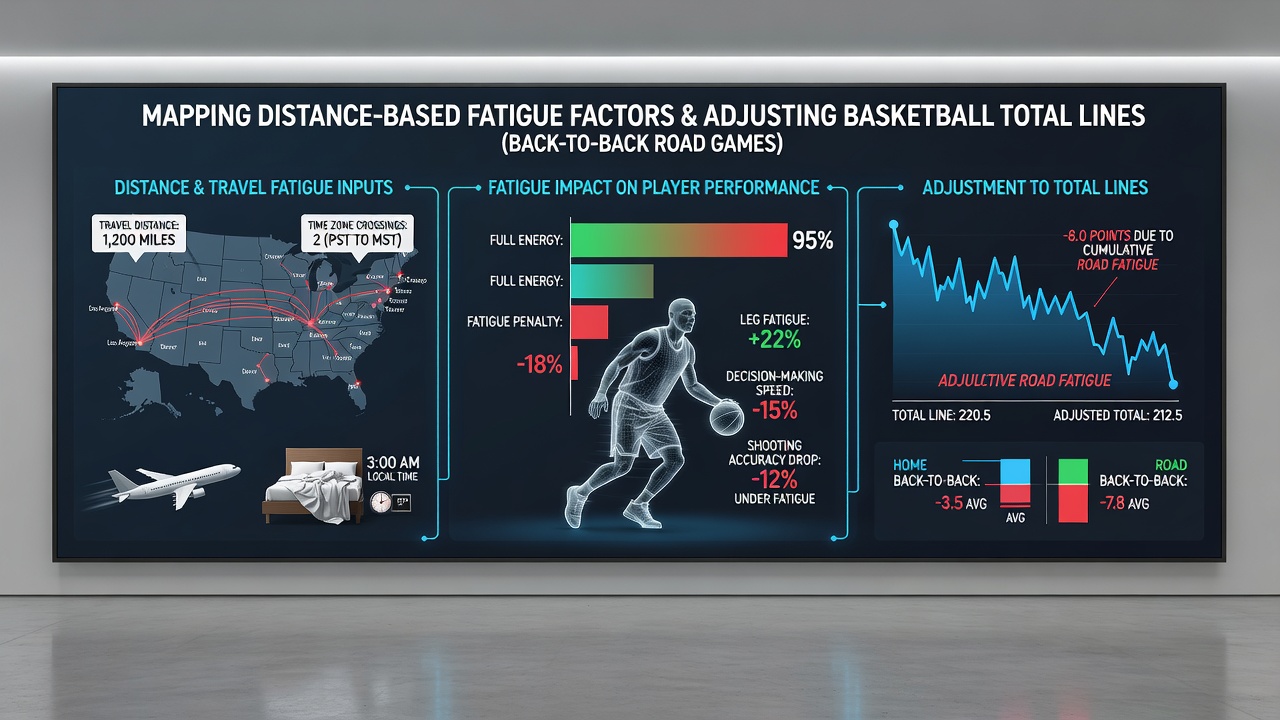
Researchers map flight times, bus transfers, and time zone shifts to quantify cumulative strain on rosters during consecutive away contests. Observers note that distances exceeding 1,000 miles between venues tend to extend recovery windows by 24 to 48 hours, which directly trims expected points in the second game. Studies from university sports laboratories indicate that circadian disruptions compound physical wear, leading analysts to lower over/under benchmarks by 4 to 7 points on average when road back-to-backs involve cross-country flights. These calculations rely on historical box scores paired with travel data rather than subjective assessments.
Performance databases reveal consistent declines in field goal percentages and rebound rates after extended travel segments, especially when teams play the following night. People who examine these datasets find that shorter hops under 400 miles produce milder effects, allowing totals to remain closer to season averages. Mapping tools integrate GPS logs with player tracking systems to isolate distance as a variable separate from rest days or opponent strength.
Adjustments to Betting Totals in Back-to-Back Scenarios
Line makers incorporate distance fatigue coefficients into algorithms that recalibrate projected game totals for road back-to-backs. Evidence from league-wide tracking shows that when cumulative travel surpasses 800 miles in a 48-hour window, combined team scoring drops measurably in the second contest. Analysts apply weighted multipliers based on mileage bands, shifting totals downward to reflect documented efficiency losses in both offense and defense. This approach accounts for variables like altitude changes and arena climates that interact with travel strain.
Figures compiled through 2025 seasons demonstrate that Eastern Conference teams traveling westward for consecutive games experience the steepest reductions in pace, often resulting in totals adjusted by 5 points or more. Those who review betting market movements observe these corrections appear early in the week as schedules release, allowing totals to stabilize before public wagering begins. The mapping process draws on regression models that test distance against outcomes while controlling for home-court advantages and recent form.
Regional Patterns and Schedule Density Effects
Geographic clusters emerge when analysts overlay travel routes onto conference schedules, highlighting how Western teams face repeated long hauls during midweek road swings. Data from North American sports analytics groups indicates that Pacific Division squads logging multiple flights within short spans see point production dip by double-digit margins compared to stationary periods. Observers tracking these trends note that July 2026 international tournaments may introduce similar distance variables for club teams preparing exhibition series, though domestic league applications remain the primary focus.
Schedule density compounds distance effects when teams string together three or more road games, creating layered fatigue that further compresses scoring outputs. Research published through academic channels shows rebounding and assist numbers decline in parallel with increased mileage, prompting total line setters to apply progressive discounts. Mapping frameworks update weekly using fresh travel manifests and updated performance baselines to maintain accuracy across varying league calendars.
Integration with Broader Performance Indicators
Distance fatigue maps combine with load management records and injury reports to refine total projections for specific matchups. Teams employing advanced recovery protocols sometimes mitigate portions of the expected drop, yet aggregate data across rosters continues to reflect lower combined outputs after extended travel. Analysts cross-reference these elements with opponent defensive ratings to isolate travel as the dominant factor in line movements. Patterns hold steady in both regular season and playoff environments where back-to-back road requirements appear.
League tracking systems provide granular inputs such as player minutes logged and heart rate recovery data that feed into fatigue models. Those reviewing the outputs find that distance thresholds trigger automatic recalibrations in projected totals, with adjustments scaling linearly up to 1,500 miles before plateauing. This systematic approach replaces earlier ad-hoc methods and delivers consistent results across multiple basketball competitions.
Conclusion
Distance-based fatigue mapping supplies a structured method for adjusting basketball total lines in back-to-back road games by linking measurable travel variables to documented performance shifts. Continued refinement of these models relies on expanding datasets that include international events and evolving schedules. The resulting adjustments reflect empirical patterns rather than isolated instances, supporting precise line calibration across professional basketball markets.